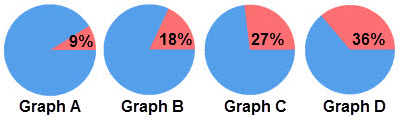
4. Which graph correctly shows the percentage of American adults considered obese in 2010?
Answer:Correct! About 36% of adults and 17% of children and adolescents are obese.Incorrect. Try Again.Incorrect. About 36% of adults and 17% of children and adolescents are obese.