5. What percentage of the U.S. population eats at a fast food restaurant at least every other day?
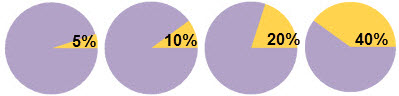
Answer:Correct! About 20%, or one out of every five Americans, eats at a fast food restaurant at least every other day.Incorrect. Try Again.Incorrect. About 20%, or one out of every five Americans, eats at a fast food restaurant at least every other day.